3 Reasons Not To Ignore Global Emerging Markets


Full article here: FSM

KEY POINTS
  • With the growing importance of the region, EM economies will make up nearly half the global economy over the next five years, making the region too large to ignore by investors
  • EM equities also continue to have little representation in global investor portfolios and equity benchmarks
  • The growth disparity between EM and developed economies is even more stark in the current environment, which should see EMs find favour amongst global investors
  • Stronger economic growth should translate to superior rates of earnings growth, driving stock market returns
  • While the growth prospects of EMs are invariably stronger, investors are currently not paying a premium for these positives; EMs actually trade at a discount to their developed market peers at present
  • We forecast strong potential upside for EM equities, and reiterate our 5.0 star “very attractive” rating on the market
Even as the IMF and World Bank recently downgraded their forecasts for global growth in 2012 and 2013, emerging markets (EMs) remain a bright spot, with long-term structural themes of increasing urbanisation, favourable demographics and a growing middle-class expected to propel their economies forward. In this update, we look at three reasons not to ignore EM equities which are currently our favourite regional equity market with a 5.0 star “very attractive” rating.

REASON 1: TOO LARGE TO IGNORE

Even as many investors still view EM equities as a peripheral “satellite” investment, the representation of EM countries in the global economy has grown by leaps and bounds. Based on the latest forecasts of the IMF, EM economies will increase their representation in the global economy to 43% by 2017, up from 38% presently (in 2012), and significantly more than the 23.5% in 1980 (see Chart 1), a function of their quicker pace of economic expansion. Simply put,over the course of the next five years, EM economies will make up nearly half the global economy, which will make the region too large to ignore by investors.
CHART 1: INCREASING REPRESENTATION IN THE GLOBAL ECONOMY

Investment Implications:

Despite their rising importance to the global economy, EM equities remain under-represented as a percentage of global equity market capitalisation, as well as within investor portfolios. As mentioned earlier, EM economies (based on the IMF classification) will make up 38% of the global economy (in nominal USD terms) in 2012. In contrast, their respective stock markets had a market capitalisation of USD10.6 trillion (as of 12 October 2012), making up just 21.1% of global stock market capitalisation.  

2689.HK

Did you sell yours? Hit our target price on Monday! 

Quite busy with work these few days, but will still try to post quick responses about the market! Another counter we are looking into is 0489.HK!

Are These Equity Funds The Most Actively-Managed?


While gains or losses of the broader equity markets ultimately drive returns of equity funds, the component of active management can also make a difference to an investor’s returns. The majority of funds on our platform are actively-managed funds, where the fund manager makes specific investment decisions with the aim of outperforming a benchmark (like Singapore equity funds trying to outperform the FTSE STI).
The extent to which a fund’s performance deviates from its benchmark is often referred to by the investment community as “active risk” or “tracking error”, terms which seem to carry negative connotations - this is simply a result of modern portfolio theory’s definition of the market (ie. the benchmark) having only “market risk”, so by deviating from the market, an investor is thus being exposed to additional investment risk.
While there are those who prefer to have less “active risk” in their investments, it is also logical that managers who deviate more from the benchmark can offer investors a better chance at obtaining stronger investment returns, which may appeal to some investors. In this article, we run a simplified quantitative “tracking error” screening of several popular categories of funds on the platform, highlighting some which appear to be more actively-managed, and others which have less tracking error.

METHODOLOGY

Our screening process utilised monthly returns (in SGD) for the funds compared against that of the benchmark, and calculated over 3-year and 5-year periods which ended in August 2012. The formula used was the “root mean square” of active returns (defined in our case as the difference in monthly returns, whether positive or negative), while we also used the same benchmark across each category – while this approach disregards the subtle “style” differences in benchmarks for different funds, it allows for a fairer peer-to-peer comparison. In addition, we also omitted funds which are principally invested in specific sectors, or small/mid-cap stocks.

RESULTS

Table 1: Average Tracking Error by Category
Category5-Year Tracking Error3-Year Tracking ErrorBenchmark Used
US
8.5%
6.0%
S&P 500
Asia Pacific ex-Japan
7.2%
4.6%
MSCI AC Asia Pacific ex-Japan
China
7.2%
6.0%
MSCI China
Asia ex-Japan
6.5%
5.8%
MSCI AC Asia ex-Japan
Europe
6.0%
4.7%
Stoxx 600
Global
5.8%
4.6%
MSCI AC World
Global Emerging Markets
5.8%
5.0%
MSCI Emerging Markets
Japan
5.1%
4.0%
Topix
Singapore
4.3%
3.1%
FTSE STI
Source: iFAST compilations, as of end-August 2012

Among the 9 categories of equity funds we examined, funds invested in the US, Asia, and China had some of the highest tracking error figures over a 5-year period, while Japan and Singapore equity funds had the lowest. With the exception of Asia Pacific ex-Japan equity funds, the trend was fairly consistent over 3 years as well. That US equity funds posted the highest tracking error amongst the various equity fund categories is somewhat surprising, since the US equity market is often viewed as one of the most efficient in the world, which would be an argument for US managers to take a more passive approach; our data appears to suggest otherwise. We now take a closer look at some of the categories to highlight funds which have demonstrated larger or smaller deviations vis-à-vis the benchmark, an indication of how actively managed the strategy is.

Full article here: FSM

Hong Kong holidays...

Hong kong is having holidays for 2 days, Monday and Tuesday so we are just looking at STI to see if there's any good picks. 

Was pretty busy these few weeks with work and didn't manage to post any insights but the markets were pretty sour for the past 1 week so it was a good chance to take a short break while monitoring how the trend is building in.

Asia Recovery Delayed Until 2013 as Manufacturing Sags


An economic recovery in Asia will likely be delayed until 2013, the latest batch of manufacturing surveys around the region suggest, with economists warning that any rebound remains dependent on Asia’s growth engine, China, picking up momentum.
Adek Berry | AFP | Getty Images

Data on Monday showed factory activity in China remained in contractionary territory for a second consecutive month in September, while manufacturing activity in regional peers, including export-focused Taiwan, and Indonesia pointed to a slowdown.
The HSBC Taiwan purchasing managers index (PMI) fell to its lowest level in ten months in September at 45.6, while Indonesia’s PMI weakened to 50.5 last month from 51.6 in August. A PMI reading above 50 indicates expansion, while a number below 50 implies a contraction.
Separately, exports out of Indonesia fell by a higher-than-expected 24.3 percent in August from a year earlier – reflecting weakening demand out of mainland China and the West.
“There are few signs yet that stabilization has set in, with fourth quarter data likely to show a further slide in activity,” Frederic Neumann, co-head of Asian economic research at HSBC told CNBC.
“This is the most challenging stretch for Asia's manufacturers since the slump caused by the Global Financial Crisis,” he added.
China - a major source of external demand for other countries in Asia - was widely forecast by economists to stage a turnaround in the second or third quarter of this year; however this has failed to materialize.

Full article here: CNBC

Just When Investors Thought Europe Was Fixed...

Investors spent most of the summer believing that central bankers would protect them from the looming European debt threat, only to find in recent days that they may be wrong.

Getty Images

Volatility has returned both on Wall Street and in the streets of Europe, where Spaniards have been protesting austerity measures, and, in doing so, sparked the realization that the sovereign debt crisis is far from over.


Stock markets around the world have been trading lower, generating some worries that Europe could put a halt to what has been an otherwise powerful 2012 rally.

"When everybody is all-in and all-long, the market is priced for perfection," says Walter Zimmerman, senior technical analyst at United-ICAP in Jersey City, N.J. "The market will only be able to tolerate good things happening. Anything that starts unfolding in the other direction, the market is going to be extremely vulnerable."

The increased nervousness has come even though European Central Bank President Mario Draghi has assured the markets that he stands at the ready to provide help to euro zone countries struggling with debt issues.

At the same time, Federal Reserve Chairman Ben Bernanke recently announced a third round of quantitative easing with the goal of driving down the U.S. unemployment rate.
 
Full article here: CNBC

Take Your Portfolio To The Next Frontier


KEY POINTS
  • Frontier markets offer great investment potential with their strong economic growth, low volatility, low correlation with major indices as well as a more "pure play" approach to gaining emerging market exposure
  • Risks include political and regulatory risks and illiquidity risks
  • Investors may gain exposure to frontier markets throught the Templeton Frontier Markets Fund

FRONTIER MARKETS: “THE NEW EMERGING EMERGING MARKETS”
Frontier markets are considered a subset of emerging markets. Compared to the majority of economies classified as “emerging markets” however, frontier markets consist of less developed, less liquid economies with companies of smaller market capitalisation. Examples of countries that are considered frontier markets include Argentina, Croatia, Romania, Kenya, Nigeria, Qatar, United Arab Emirates, Sri Lanka and Vietnam.
Frontier markets are a relatively new class of investment; of the three major frontier market index providers, the earliest was only launched in May 2009 by MSCI Barra – the MSCI Frontier Markets Index. The FTSE Frontier 50 Index and the S&P Frontier BMI were launched in September 2010 and April 2011 correspondingly.
For the purpose of this article, we will compare the investment merits of frontier markets by comparing the MSCI Frontier Markets Index against its US, developed markets, and emerging markets counterparts. The indices used are the MSCI US Index, MSCI World ex-US Index and the MSCI Emerging Markets Index respectively.


Full article here: FSM 

2689.HK

As we did some coverage on some HK stocks, we have opened a position in 2689.HK as mentioned earlier in the week.

Previous coverage: Hong Kong stocks

As markets seem to be less optimistic after QE3 has been announced, China has been in the limelight with no expansion (luckily with no contraction) on their manufacturing numbers. It is widely acknowledged that China has to grow at least above 50 PMI to show sustainable results but it has been below 50 (ranging around 46-48) over the past 9 months and SSE is at its 4 years all time low (comparable to 2009's financial crisis).

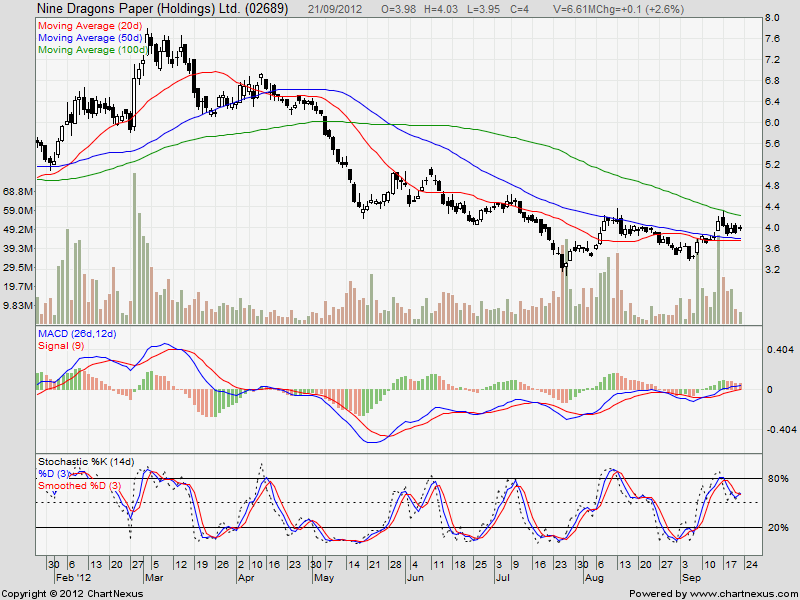
Nevertheless, HSI has shown pretty strong resilience against the figures from China but it's not showing big movements for penny stocks like 2689.HK. Looking at the charts below:


Trending in between $3.82 - $4.30 for the past 1 week, it didn't had an opportunity to actually break above $4.40 and the 100d MA is showing good resistance for breakout (it touched on 21 Sept). Looking at the stochastics, it is still on the high band and looks like more of a upward movement and notice the 20MA which is going near to the 50MA which signals a potential breakout as well. 

Our target price for this counter is at $4.60 - $4.65 depending on market sentiments and cut price at $3.75. 

Your thoughts? 

Apple Seeks US Samsung Sales Ban, Additional Damages


Jung Yeon-Je | AFP | Getty Images
Samung flag flies in Seoul

Apple has asked for a court order for a permanent U.S. sales ban on Samsung Electronics products alleged to have violated its patents along with additional damages of $707 million on top of the billion-dollar verdict won by the iPhone maker last month.
Samsung has responded by asking for a new trial.
The world's top two smartphone makers are locked in patent battles in 10 countries as they vie for top spot in the lucrative, fast-growing market.
Apple [APPL  92.00  ---  UNCH    ] scored a legal victory over Samsung in late August when a U.S. jury found that the Korean firm had copied critical features of the iPhone and awarded the U.S. firm $1.05 billion in damages.
In a motion filed late Friday U.S. time, Apple sought a further $400 million damage award for design infringement by Samsung; $135 million for willful infringement of its utility patents; $121 million in supplemental damages based on Samsung's product sales not covered in the jury's deliberation; and $50 million of prejudgment interest on damages through December 31.
The requests together come to $707 million.
Apple wants the injunction to cover "any of the infringing products or any other product with a feature or features not more than colorably different from any of the infringing feature or features in any of the Infringing Products." Such a wide-ranging sales ban could result in the extension of the injunction to cover Samsung's brand-new Galaxy S III smartphone.

Full article here: CNBC

Idea Of The Week: Gaining Access To Frontier Markets


As described in Take Your Portfolio To The Next Frontier, frontier markets offer investors the potential to reap healthy investment gains, helped by their strong projected economic growth, while also providing some portfolio diversification benefit from lower correlations with other financial markets. Nevertheless, their small market capitalisations, lower liquidity and less-developed stock markets mean that there are precious few options for investors who want exposure to this fast-growing segment within the broader global emerging markets. In this week’s “Idea of the Week” segment, we highlight several funds which offer investors exposure to the frontier markets.

TEMPLETON FRONTIER MARKETS FUND
Among the various funds on the platform, the Templeton Frontier Markets Fund offers investors the most direct exposure to the segment. The fund was launched only in October 2008, but has since impressed with its strong outperformance of its benchmark, the MSCI FM Frontier Markets index. As of 31 July 2012, the fund’s largest holdings (by country) were in Nigeria, Kazakhstan, Qatar and Vietnam, deviating significantly from the benchmark (which had almost a third in stocks from Kuwait), and coupled with the strong outperformance since inception, suggests that the manager employs a highly active (benchmark-agnostic) approach to managing the portfolio.

MENA FUNDS
The three MENA (Middle East and North Africa) funds on the platform may also be interesting for investors seeking exposure to the various frontier markets located within the region (which includes markets like Jordan, Qatar, Kuwait, the UAE and Oman). Nevertheless, these three funds have had rather different fortunes in 2012 so far, owing to the disparity in their investment approaches. The Schroder ISF Middle East SGD A Acc  has delivered a rather strong 19.6% year-to-date return (as of 12 September 2012), helped by its fairly large allocation to Turkish equities – the fund held 35.1% of the portfolio in Turkey, as of 31 July 2012; the Turkish equity market has delivered a 34% return over the same period. The fund’s benchmark is 80% MSCI Arab Markets and Turkey + 20% Saudi Arabia Large/Mid Cap.
In contrast, the Amundi Oasis MENA Fund SGD and ING Inv MENA USD have delivered returns of 5.7% and 4.3% year-to-date, a function of not owning strong-performing Turkish equities (as compared to the Schroder ISF Middle East SGD A Acc). Both have allocation to Qatar and Kuwait, while the ING Inv MENA USD’s fairly large allocation to each of its top-10 holdings suggests a more high-conviction approach vis-à-vis the Amundi Oasis MENA Fund SGD.

EMERGING EUROPE, MIDDLE EAST & AFRICA EQUITY FUNDS
With Nigeria being one of the larger investable frontier markets at present, it is worth mentioning the “Emerging Europe, Middle East and Africa” equity funds on our platform. We have previously highlighted the Fidelity EmEur MidEast & Africa A USD in “Idea of the Week: 3 Recommended Funds You Haven’t Heard Of Yet [13 July 2012]”, highlighting the use of the fund alongside a Latin America equity fund for allocation to global emerging markets, to avoid over-concentration in Asia ex-Japan. As of 31 July 2012, we note that the fund held 7.3% of its assets in Nigeria (along with 1.7% in another frontier market, Kenya). Its peer, the JPM EmEu MEast & Africa SGD A Acc, held 3.6% of its assets in Nigeria, with a further 2.2% and 2.1% in Kazakhstan and Qatar respectively.

LIONGLOBAL VIETNAM FUND
Within Asia, Vietnam is one frontier market which is gradually opening up its doors to overseas investors. On the platform, the LionGlobal Vietnam SGD provides exposure to Vietnam stocks, and is benchmarked against the FTSE Vietnam Index. While the fund has generally not fared well since its inception in February 2007, the fund has still delivered outperformance against its benchmark, highlighting the positive impact of an actively-managed strategy (the fund manager has the option to invest in companies listed outside of Vietnam, but which derive part of their revenue from Vietnam and the Indo-China region). 
While the fund has the dubious honour of being one of the worst-performing funds on the platform (over a 5-year period), this may be attributed to the excessive valuations of the Vietnam equity market previously (see Chart 1). Valuations have since receded, and the market currently trades at 9.9X 2012 earnings (as of 14 September 2012), a far cry from the 30 – 40x PEs seen in 2007, suggesting that the market is a far more interesting investment proposition currently.  

CHART 1: VIETNAM EQUITY VALUATIONS

Full article here: FSM